What accounts payable KPIs actually measure
A KPI is only useful if it maps to a decision. Accounts payable KPIs fall into five groups, and a healthy dashboard carries at least one from each, because optimising one group in isolation usually damages another.
Speed and efficiency: how fast an invoice moves from receipt to payment readiness, and how much each person gets through. Slow AP means late payments and missed discounts.
Cost: what it costs to process an invoice, all in. This is where automation shows up, but it is an output of everything else on this list.
Accuracy and quality: how often invoices are wrong, duplicated, or need a human to fix them. Errors are the hidden tax on AP.
Cash and working capital: how long you hold cash before paying, measured as days payable outstanding. This is the CFO's lever, and it trades against supplier goodwill.
Vendor relationships: whether suppliers are paid on time and get answers quickly. Ignore this and you pay for it in worse terms and supply risk.
The core AP KPIs, with formulas and benchmarks
Here are the metrics that belong on almost every AP dashboard, each with its formula, a current benchmark, and what it tells you. The market figures below come from Ardent Partners' State of ePayables 2025; best-in-class means Ardent's top 20 percent. The next section shows how to place yourself against them.
KPI | Formula | Market avg (2025) | Best-in-class |
|---|---|---|---|
Cost per invoice | AP cost / invoices | $9.84 | About $2 (79% lower) |
Invoice cycle time | Receipt to approval | 8.2 days | Under 2 days (79% faster) |
Exception rate | % needing a manual fix | 18.4% | About 9% (47% lower) |
Straight-through rate | % with no manual touch | Baseline | 1.8 times more than peers |
Supplier e-invoice adoption | % on e-invoicing | 57% | 1.4 times more than peers |
Staff time on supplier queries | % of AP time on queries | 21.9% | About half |
Sources: Ardent Partners, State of ePayables 2025 (market and best-in-class); APQC (percentile spread).
Behind the table, the metrics group into the same five dimensions.
Speed and efficiency
Invoice processing time: average time from receiving an invoice to approval and payment readiness. It exposes where invoices sit waiting, usually in an approver's inbox.
Invoice cycle time: the full end-to-end clock, from vendor receipt to cash out the door. Best-in-class is around three days; manual teams run two to three weeks.
Straight-through processing (STP) rate: the share of invoices that flow from receipt to posting with no human touch. Also called the touchless or no-touch rate, it is the best single proxy for how automated you really are.
Invoices processed per FTE: how many invoices each full-time employee handles. A manual clerk manages a few thousand a year; an automated one can clear well over ten thousand.
Cost and financial control
Cost per invoice: total processing cost, labour, software and overhead, divided by invoices processed. It is the headline number, but treat it as a scoreboard, not a lever.
Early payment discount capture rate: the share of available vendor discounts you actually take. Missed discounts are free money left on the table.
Days payable outstanding (DPO): the average number of days you take to pay, calculated as accounts payable divided by cost of goods sold, times the days in the period. It is the CFO's working-capital dial.
On-time payment rate: the share of invoices paid on or before the due date. Below the mid-90s you start to see credit holds and strained suppliers.
Accuracy and quality
Invoice exception rate: the share of invoices needing a human to fix a price, quantity or data mismatch. Every exception is slow and expensive, so this number quietly drives your cost per invoice.
Duplicate payment rate: how often the same invoice gets paid twice. The target is zero, because even a fraction of a percent of a large spend is real money walking out the door.
PO match rate (first-pass): the share of invoices that match their purchase order on the first try, on two-way or three-way matching. A low match rate is usually a procurement problem showing up in AP.
Vendor relationships
Vendor inquiry volume: how often suppliers call to ask where their payment is. A rising number is an early warning that something upstream is slow or unclear.
Supplier satisfaction: how vendors rate your timeliness and query resolution. Resolution under about two days is considered strong.
Where you actually stand: how to read these benchmarks
A benchmark is only useful if you know which one applies to you. The market average and the best-in-class figures answer two different questions, and most teams quietly compare themselves to the wrong one.
Ardent Partners defines best-in-class as the top 20 percent of AP teams by lowest cost and shortest cycle time. Those teams run about 79 percent cheaper and faster than everyone else, process nearly twice as many invoices straight through, and clear far fewer exceptions. That gap is the whole prize.
For the shape of the field, APQC's cross-industry data puts the top quartile near $2, the median around $5.80, and the bottom quartile at $10 or more. It is older data, so treat it as the distribution, not a live figure, and anchor your expectation to the 2025 average of $9.84.
Benchmarks also vary by sector, DPO most of all. Retail runs shorter terms, often 30 to 45 days; manufacturing and construction run longer, 45 to 90; technology and services sit in between. Be wary of tables showing healthcare or financial services at 180 or 400 days, those are accounting artifacts from non-trade payables, not how fast anyone pays a supplier. Compare yourself to your own sector.
The honest takeaway: do not chase the best-in-class number in year one. Find your tier, then target the next one.
What the KPIs look like on real numbers
Formulas are easy to nod along to and hard to feel. Here is what they mean for a company processing 10,000 invoices a month, or 120,000 a year.
Cost per invoice: with five AP staff plus systems and overhead costing about $1.02 million a year, that is $8.50 an invoice, just above the market average. The same volume at best-in-class, near $2, would cost about $250,000. The efficiency gap is roughly $770,000 a year on processing alone.
Exception rate: at the 18.4 percent market average, that is about 22,000 exceptions a year. At a conservative $40 to $50 to resolve each one, exceptions quietly cost $75,000 to $95,000 a year on this volume.
DPO: with $8 million in payables against $73 million in cost of goods sold, DPO is 8 divided by 73, times 365, or about 40 days. Negotiate terms that lift payables to $12 million on the same spend and DPO reaches 60 days, freeing $4 million in cash.
None of these are exotic numbers. They are what an average mid-sized AP function looks like, and they show why the drivers behind cost per invoice are worth real money.
The AP KPI cheat sheet
One page to keep. Every KPI in this guide, with its formula and a sensible target. The targets are good-practice marks for an automated team; set your own against your baseline and industry, not a number from a competitor's blog.
KPI | Formula | Good target |
|---|---|---|
Cost per invoice | AP cost / invoices | Under $3; best near $2 |
Invoice cycle time | Days, receipt to approval | Under 5 days; best 2 to 3 |
Straight-through rate | % with no manual touch | 70%+ for automated teams |
Exception rate | % needing a manual fix | Under 10%; best near 5% |
Invoices per FTE | Annual invoices / AP headcount | 10,000+ per FTE |
Days payable outstanding | (AP / COGS) x days | Agreed terms, paid on time |
On-time payment rate | % paid by due date | Above 95% |
Discount capture rate | Discounts taken / available | Above 90% |
PO match rate (first-pass) | % matching the PO first time | 80% or more |
Duplicate payment rate | Duplicate payments / total | Zero |
Vendor inquiry volume | Supplier payment-status contacts | Trending down |
First-time match rate | % clearing match on first pass | 80% or more |
Approval cycle time | Days waiting for sign-off | Under 2 days |
Rework rate | % touched more than once | Under 5% |
The AP maturity model: where your numbers put you
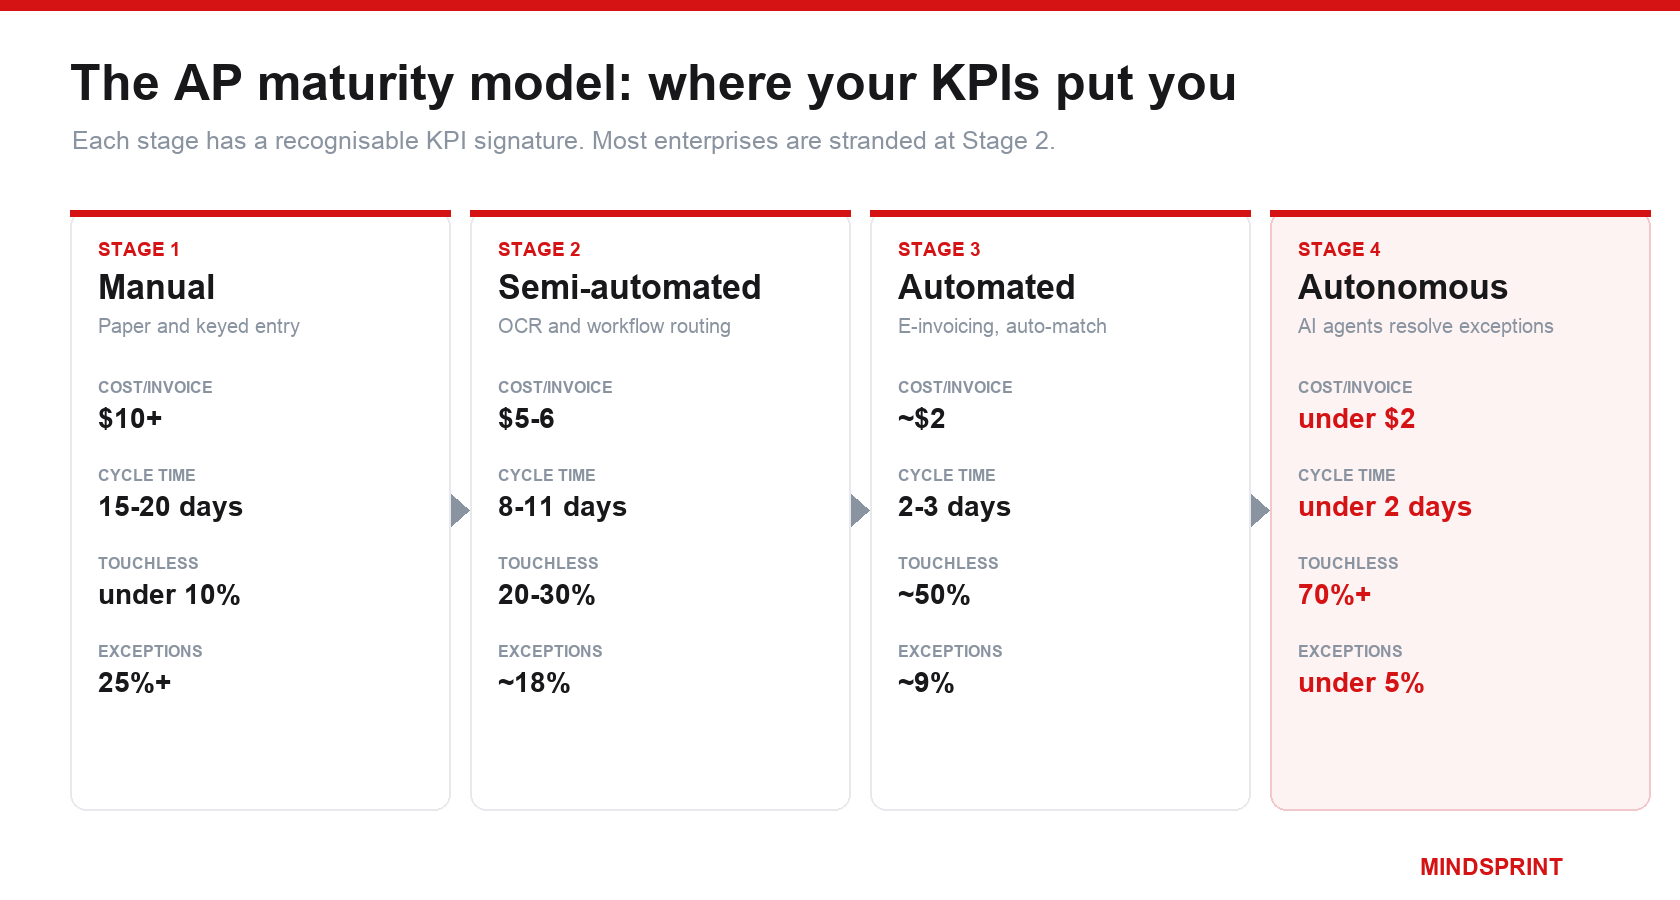
Every AP function sits somewhere on a maturity curve, and each stage has a recognisable KPI signature. Finding your stage tells you what to fix next better than any single benchmark does.
Stage 1, manual: paper and PDF invoices keyed by hand, tracked in spreadsheets. Cost per invoice above $10, cycle times of 15 to 20 days, under 10 percent touchless, exceptions above 25 percent.
Stage 2, semi-automated: OCR capture and workflow routing, partial ERP integration. Cost around $5 to $6, cycle times of 8 to 11 days, 20 to 30 percent touchless. This is where the market average sits.
Stage 3, automated: e-invoicing and automatic two and three-way matching, with humans touching only exceptions. Cost near $2, cycle times of two to three days, touchless approaching half of all invoices.
Stage 4, autonomous or agentic: AI agents code, match and resolve most exceptions on their own, and people handle policy and edge cases. Touchless above 70 percent and exceptions below 5 percent are the direction of travel.
Most enterprises are stranded at Stage 2, paying Stage 2 costs while their best-in-class peers operate at Stage 3 and pilot Stage 4. The value of the model is that it turns a vague ambition, be more efficient, into a concrete next move.
Outputs versus drivers: which KPIs to fix first
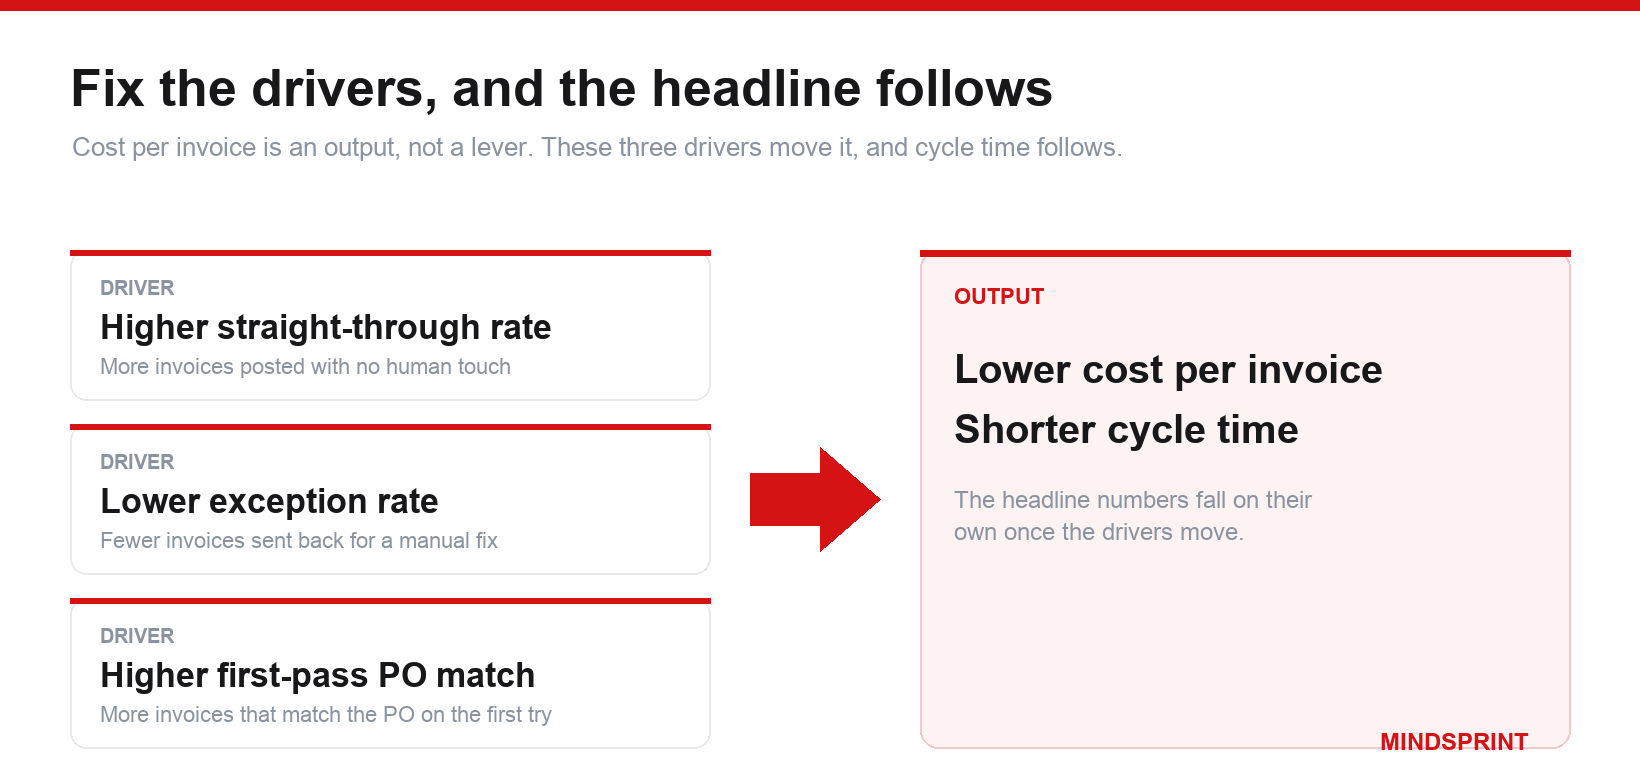
The mistake most teams make is chasing cost per invoice directly. You cannot lower it by asking people to work faster, because it is an output. It is the sum of everything upstream: how many invoices need a human, how many throw exceptions, how many match the PO on the first pass.
Three KPIs are the real drivers. Lift your straight-through processing rate, cut your exception rate, and raise your first-pass PO match rate, and cost per invoice falls on its own, with cycle time following. That is the order of operations: fix the drivers, and the headline number takes care of itself.
It also tells you where to look when a number moves. A rising cost per invoice is a symptom; the diagnosis is almost always in the drivers, a drop in touchless processing or a spike in exceptions, often traced to one vendor sending bad data or one entity working around the process.
Why invoices become exceptions, and how to fix each cause
Exception rate is the driver that quietly sets your cost per invoice, because every exception is a clean invoice plus a person. The useful question is not what your exception rate is, but what causes it, since each cause has a different fix and a different owner.
Here is the reframe that matters: most exceptions are born upstream, before AP ever sees the invoice. An outdated PO price, a goods receipt entered late, a stale vendor record. AP is where exceptions surface, not where they start, so cutting the exception rate is mostly a procurement, receiving and master-data job, not an AP one.
Exception cause | How to fix it | Who owns the fix |
|---|---|---|
Price mismatch to PO | Update POs on contract change; right-size tolerances; portal PO-flip | Procurement |
Quantity or receipt mismatch | Enforce timely goods receipting; auto-receipt services; tolerances | Receiving |
Missing or invalid PO number | No PO, no pay policy; guided buying that forces a PO upstream | Procurement |
Missing goods receipt | Auto-receipt low-risk categories; chase receivers on an aging SLA | Receiving |
Non-PO invoice | Auto-code by GL and vendor rules; convert recurring spend to POs | Procurement and AP |
Duplicate submission | Duplicate detection on invoice, vendor and amount; one intake channel | AP |
Missing or wrong invoice data | Structured e-invoicing that blocks submission without mandatory fields | AP and IT |
Tax and coding errors | Automated tax validation and auto-coding; reject non-compliant at intake | Tax and AP |
Stale vendor master data | Cleanse and deduplicate the vendor master; one system of record | Master data |
One honest caveat: the exact share each cause contributes is not publicly benchmarked, so any blog quoting a neat percentage split is guessing. Measure your own top three by volume, because that is where a fix pays off, and it differs by company.
How to actually move each number
Knowing the benchmark is not the same as knowing the lever. Here are the specific moves that shift each KPI, in rough priority order, so improvement becomes a plan rather than a wish.
Touchless rate: get structured data at the source through supplier portals, PO-flip or e-invoicing, so the invoice inherits PO data instead of being scanned. Then automate the three-way match with sensible tolerance bands, auto-code non-PO invoices with GL rules, and set recurring invoices like rent and utilities to post straight through. The ceiling is set by how much spend sits on a PO.
Cost per invoice: it follows the touchless rate, so start there. Then cut rework by fixing exceptions, consolidate to a single intake channel to kill duplicate handling, and move some payment volume to rebate-bearing virtual cards to offset cost.
Cycle time: the biggest single lever is routing approvals in parallel rather than in sequence, which in practice can turn a 16-day chain into about 4 days. Add auto-approval thresholds for low-value invoices that meet every rule, approval SLAs with automatic escalation, and mobile sign-off to end approver-unavailable delays.
Discount capture: compress cycle time first, because the discount clock starts when the invoice arrives and a slow process forfeits the window mechanically. Then fast-track discount-bearing invoices ahead of the queue, and use dynamic discounting to capture partial value after day ten.
DPO: negotiate longer standard terms where your leverage allows, stop paying early by default, and use supply-chain financing to extend your payment date without starving the supplier of cash.
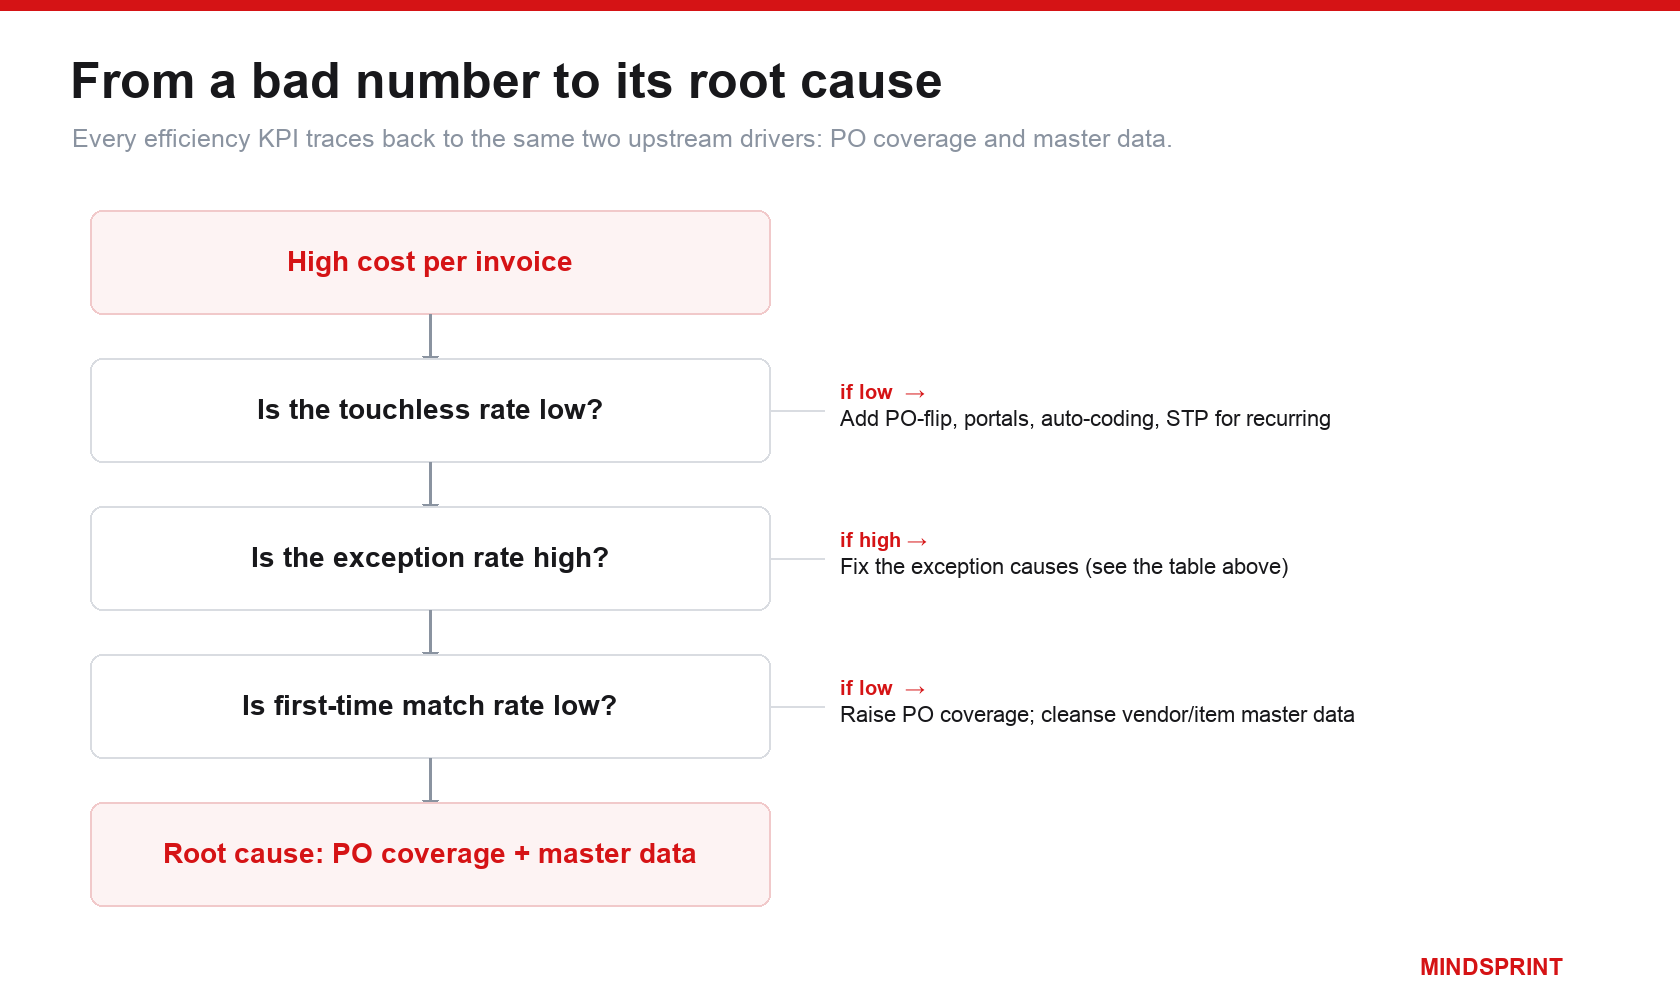
When a number moves the wrong way, trace it rather than guess. The path is almost always the same, and it ends at the same two upstream drivers.
The KPIs that fight each other
Read in isolation, every KPI looks like something to maximise. Read together, several pull in opposite directions, and managing that tension is the actual job.
The sharpest trade-off is DPO against everything vendor-facing. Stretch it and you hold cash longer, which the CFO likes; stretch it too far and you miss discounts and slip below your on-time target. A high DPO that just means paying late is a deferred bill.
Early-payment discount capture pulls the other way. Taking a two percent discount for paying ten days early is a strong return on cash, but only if you have the speed to approve invoices in time. A team with a twenty-day cycle time cannot capture a ten-day discount, however much it wants to.
Cost per invoice trades against control. You can always make AP cheaper by removing a review or an approval, but every control you cut raises the odds of a duplicate or fraudulent payment. The cheapest AP function is not the best one if it leaks money out the back.
The point is not to maximise any single metric. It is to set a deliberate balance: enough DPO to fund the business, enough speed to capture discounts and pay on time, and enough control to keep the accuracy metrics clean.
DPO and working capital: the number the CFO actually cares about
For the AP manager, the operational KPIs matter most. For the CFO, one metric outranks them all, because it turns AP into cash: days payable outstanding.
DPO is accounts payable divided by cost of goods sold, times the days in the period. It sits inside the cash conversion cycle: days sales outstanding plus days inventory outstanding minus DPO. DPO is the only term that subtracts, so every extra day shortens the cycle and frees cash.
The math is blunt at scale. One day of DPO is worth about a day of cost of goods sold in freed cash. For a company with $3.65 billion in annual COGS, that is $10 million a day; five days frees $50 million, once. That is why treasurers push on it.
The market has been pushing hard. The Hackett Group's 2025 working capital survey found DPO rebounded to 59 days among large US companies, and still counted $1.7 trillion in excess working capital tied up across them. The payables lever did most of the work.
The trap is confusing a high DPO from negotiated terms with a high DPO from paying late. The first is good treasury; the second forfeits early-payment discounts, strains suppliers and eventually returns as worse pricing. Best-in-class means longer agreed terms paid on time, not due invoices left to age.
The real math on early-payment discounts
Early-payment discounts look small and are not. A common two percent discount for paying within ten days instead of thirty is worth about 37 percent annualised, because you earn two percent for moving payment up twenty days. Passing it up is like lending your supplier money at 37 percent.
So why do teams miss it? Not the math, the process. Industry data has long shown only about a third of organisations capture every discount available, while roughly one in seven never do. The reasons are lengthy approval cycles, manual routing and missing invoice information, the same things that inflate cycle time.
This is the hidden link between two KPIs. A team with an eight-day average cycle cannot reliably hit a ten-day discount window; a three-day team can. Cycle time is not just a speed metric, it is the gate on free money.
The money leaking out: duplicate and erroneous payments
The duplicate payment rate reads like a rounding error and behaves like a leak. Across industries, roughly 0.1 to 0.5 percent of AP spend is lost to duplicate or erroneous payments, and the rate spikes after acquisitions and ERP migrations, when vendor records and invoice histories collide.
On a $2 billion spend, even the conservative 0.1 percent is $2 million a year walking out the door. Recovery audit firms routinely claw back on the order of a million dollars per billion of spend, which tells you how much slips past before anyone notices.
This is why controls belong in the cost-per-invoice conversation. The cheapest process, with a matching step or approval removed, is not the cheapest once you count what leaks out the back. The target for duplicates is zero, reached through clean data and automated matching, not more checkers.
How AP KPIs get gamed
Any metric that gets managed can get gamed, usually without anyone deciding to cheat. These are the patterns worth watching for.
Paying early to hit on-time rate: the fastest route to a perfect on-time payment rate is to pay everything the moment it arrives. It also destroys your DPO. On-time should mean on the due date, not before it.
Cutting controls to lower cost per invoice: dropping a matching step or an approval threshold makes the cost number look great, until the first duplicate or fraudulent payment lands.
Excluding the hard invoices from the STP number: a touchless rate that only counts clean, PO-backed invoices flatters itself. Measure it across all invoices, or you are counting the easy ones twice.
A cost per invoice that hides rework: if the number leaves out the time spent chasing exceptions and answering vendor calls, it is not the real cost. The exceptions are where the money goes.
The defence is the same every time: never look at one KPI alone. A number that improves while its natural counterweight gets worse is not progress, it is displacement.
The KPIs most teams miss
The headline metrics get all the attention, but the teams that actually improve tend to watch a second layer, the leading indicators that move before cost and cycle time do.
First-time match rate: the share of invoices that clear two or three-way matching on the first pass. It is the upstream driver of both touchless rate and exception rate. Aim for 80 percent or more.
Percentage of spend under PO: how much spend runs through a purchase order. High PO coverage is what makes automatic matching possible and keeps maverick spend in check. Eighty percent of eligible spend is a strong mark.
Approval cycle time: the time an invoice waits for sign-off. It is usually the biggest single chunk of total cycle time and the main reason discounts get missed. Target under two days.
Rework rate: the share of invoices touched more than once. Pure waste, and a close cousin of the exception rate. Keep it under five percent.
Cost of an exception: the fully loaded cost to resolve one problem invoice, often three to four times a clean one. It puts a price on the exception rate and builds the case for fixing root causes.
Supplier portal adoption: the share of suppliers submitting and checking status themselves. It directly cuts the inquiry load, which eats about a fifth of AP staff time at the average company.
On-time payment against terms: the share of invoices paid on the agreed date, neither early nor late. It is what separates a healthy high DPO from simply paying late.
None of these need a new system to start tracking. They need agreement on the definition and the discipline to look every month.
AP KPIs by role and goal
Not everyone needs the same numbers. A useful dashboard shows each audience the metrics they can act on, and each strategic goal the levers that move it.
The CFO watches DPO, discount capture and total cost, because those move working capital and the P&L.
The AP manager watches cycle time, straight-through rate, exception rate and cost per invoice, the levers they control day to day.
The vendor-relations lead watches on-time payment rate, inquiry volume and supplier satisfaction.
By goal, the priorities shift. To reduce cost, focus on straight-through rate, exception rate and duplicate payment rate, and cost per invoice follows. To speed up cycles, focus on cycle time, PO match rate and invoices per FTE. To protect supplier relationships, focus on on-time payment rate, discount capture and inquiry volume.
The same KPI reads differently by setup. In a manual process, a high exception rate points to data-entry typos and missing paperwork; in an automated one, to integration errors or bad vendor data. A rising cost per invoice means labour and paper manually, licensing versus volume when automated.
The skills behind the numbers
KPIs do not move themselves. Behind every best-in-class scorecard is a team with a particular mix of skills, and that mix has shifted as AP has automated. The clerk who once keyed invoices now manages exceptions, data and suppliers. If you are hiring or reskilling an AP team, these are the capabilities the numbers actually depend on.
Data and analysis: reading the metrics, spotting which driver moved, and building the dashboard. This is now the core skill of a modern AP team, not a nice-to-have.
Process and controls: knowing the two and three-way match, segregation of duties, and where a control must not be cut. This is what keeps the accuracy metrics honest.
ERP and automation fluency: configuring workflows, match rules and integrations, and working alongside the software agents rather than around them.
Vendor communication: resolving queries quickly and keeping suppliers informed, which is what actually moves inquiry volume and supplier satisfaction.
Compliance awareness: tax, e-invoicing mandates and audit requirements, which multiply fast across several countries.
As automation takes the keying away, the value of the team moves up the stack, from processing invoices to managing the exceptions, the data and the relationships the numbers depend on.
Benchmarking across a multi-country operation
For a business that runs AP in one country, a single set of KPIs is enough. For one that runs across many, a single blended number is a trap.
Cost per invoice, cycle time and touchless rate all vary by country, as tax rules, mandates, banking rails and vendor maturity differ. An entity under a mandatory e-invoicing regime may look cheap because the format arrives clean; a paper-heavy market looks expensive through no fault of its team. Blend them and the signal disappears.
Mature global AP organisations benchmark per entity and per region first, then roll up. They compare each entity against its own local reality and against best-in-class for that market, not against the group average. The group number is for the board; the per-entity numbers are for improvement.
The rollup also has to survive different systems. If each country runs a different ERP or local AP tool, the KPIs only mean the same thing when they are defined and calculated the same way everywhere. Agreeing the formulas once, centrally, is half the work of multi-country AP measurement.
Why your KPI isn't their KPI
Before you compare your numbers to anyone else's, know that two companies rarely calculate the same KPI the same way. Most benchmark disappointments are definition mismatches, not performance gaps.
Touchless rate: does it count non-PO invoices that auto-post through coding rules, or only true three-way-matched invoices? Including the former inflates the number, so always state the denominator.
Cost per invoice: a thin version counts only labour. A rigorous one adds software, licensing, storage, IT support and payment fees, and the honest version also loads in rework and missed-discount leakage. That scope gap alone explains why the same metric varies three to five times between firms.
Cycle time: receipt-to-approval and receipt-to-payment are different metrics, and the start point, invoice date or arrival in AP, shifts the whole number. Pin both ends before you compare.
DPO: a period-end snapshot of payables can swing the number if payments cluster at quarter-end. Average payables is the rigorous method, and non-trade payables leaking into the balance inflate it.
None of this is pedantry. It is why a benchmark is a direction, not a verdict, and why your own trend line, measured the same way every month, is worth more than any external number.
How to set targets you can actually hit
Benchmarks tell you what is possible. Targets tell your team what to aim for this year. Turning one into the other is where most KPI programs quietly fail.
Start from a real baseline: measure your own cost, cycle time, touchless rate and exception rate from actuals over at least a quarter before setting a single target. A target with no baseline is a guess.
Locate yourself on the map: plot against the percentile spread and the current market average. Knowing whether you are a laggard, near the median, or closing on best-in-class decides how far you can reasonably move.
Aim for the next tier, not the moon: a median team should target the edge of the next quartile, not best-in-class in twelve months. Tie the target to a maturity-stage move, not a number from a competitor's blog.
Set the metrics as a system: target cost, cycle time, touchless rate and exception rate together, so no one hits one by quietly wrecking another.
Attach the money: translate each target into cash, cost per invoice times volume, a DPO day times daily COGS, discount capture times spend. That is what earns a CFO's sponsorship and survives the budget round.
Set this way, targets stop being a wish list and become a plan, one that ties every metric back to either cash or risk.
The first 90 days: a KPI improvement roadmap
Benchmarks and targets mean nothing without a sequence, and what actually moves the needle follows a clear order. You cannot optimise working capital on a slow, exception-ridden process, so fix the flow first and the cash last.
Days 0 to 30, baseline and instrument: define each KPI precisely, then measure cost per invoice, cycle time, touchless rate, exception rate, first-time match rate, percentage of non-PO spend and discount capture. Root-cause your top three exception types by volume, and consolidate intake to one channel, which kills duplicates immediately.
Days 30 to 60, quick wins: turn on duplicate detection, retune tolerance bands so trivial variances auto-pass, switch approvals from serial to parallel, and set auto-approval thresholds with escalation SLAs. These cut cycle time and cost with no upstream dependency.
Days 60 to 90, structural fixes: launch no PO, no pay and guided buying, start cleansing the vendor master, and fix goods-receipt timeliness. This is where first-time match rate and exception rate improve for good, slower to land but the biggest payoff.
Quarters 2 to 4, compounding: roll out supplier portals and e-invoicing to raise the touchless ceiling, auto-code non-PO invoices, add dynamic discounting, and only then renegotiate terms and stretch DPO, once cycle time is reliable enough to pay on time.
The sequence is the point. Quick wins buy credibility and cash in weeks; the upstream fixes in procurement, receiving and master data are what move the drivers, so they come next, not first.
How agentic AP moves the numbers
Most of these KPIs move together when you take the manual handling out of the middle. Automating capture, coding, matching and approval routing is what lifts the straight-through rate, and the touchless rate is what drags cost per invoice and cycle time down behind it.
Ardent's data makes the point bluntly: the automation-heavy best-in-class run about 79 percent cheaper and 79 percent faster than their peers, process nearly twice as many invoices straight through, and clear roughly half the exceptions. The automation gap is the performance gap.
It shows up case after case: AI-based matching lifting touchless rates from the forties into the seventies, and invoice handling dropping from fifteen minutes to under three, once the agents take the keying and chasing away.
This is where an agentic AP layer earns its place. Instead of rules that only handle clean invoices, software agents read each invoice, code it, run the two or three-way match, chase exceptions and route for approval, learning each vendor's quirks. Invoices that used to become exceptions increasingly do not.
SprintAP is an agentic AP platform from a team that ran multi-country AP for two decades. It ingests structured e-invoices and plain documents, then validates, codes, matches and posts them to your ERP with full controls and an audit trail. It is ERP-agnostic, so it reports the same KPIs across every system. The promise is honest: a higher touchless rate and lower exception rate, not a magic cost number.
Where an agentic AP layer fits
Accounts payable KPIs are not a scorecard to admire, they are a control system. The teams that get the most from them measure a few numbers well, watch the drivers rather than the outputs, and respect the tensions between cash, speed and supplier trust instead of maximising one at the others' expense.
Automation lets you improve several KPIs at once without robbing Peter to pay Paul, and an agentic AP layer keeps the drivers moving in the right direction, entity by entity, as volume grows. Start with a clean baseline, fix the drivers, and let the headline numbers follow.